How to Calculate Weeks Cover for Your Shopify Store
By Canopy Team
Quick answer
Weeks cover is calculated by dividing your current stock quantity by your average weekly sales velocity: Weeks Cover = Current Stock / Average Weekly Sales. For example, if you have 120 units of a product and sell an average of 15 per week, your weeks cover is 8 weeks. This means at current sales rates, you have 8 weeks before you run out. For Shopify stores, you need to pull stock levels from Shopify admin and calculate weekly sales from your order data. Our free inventory calculator at /inventory-calculator does this automatically.
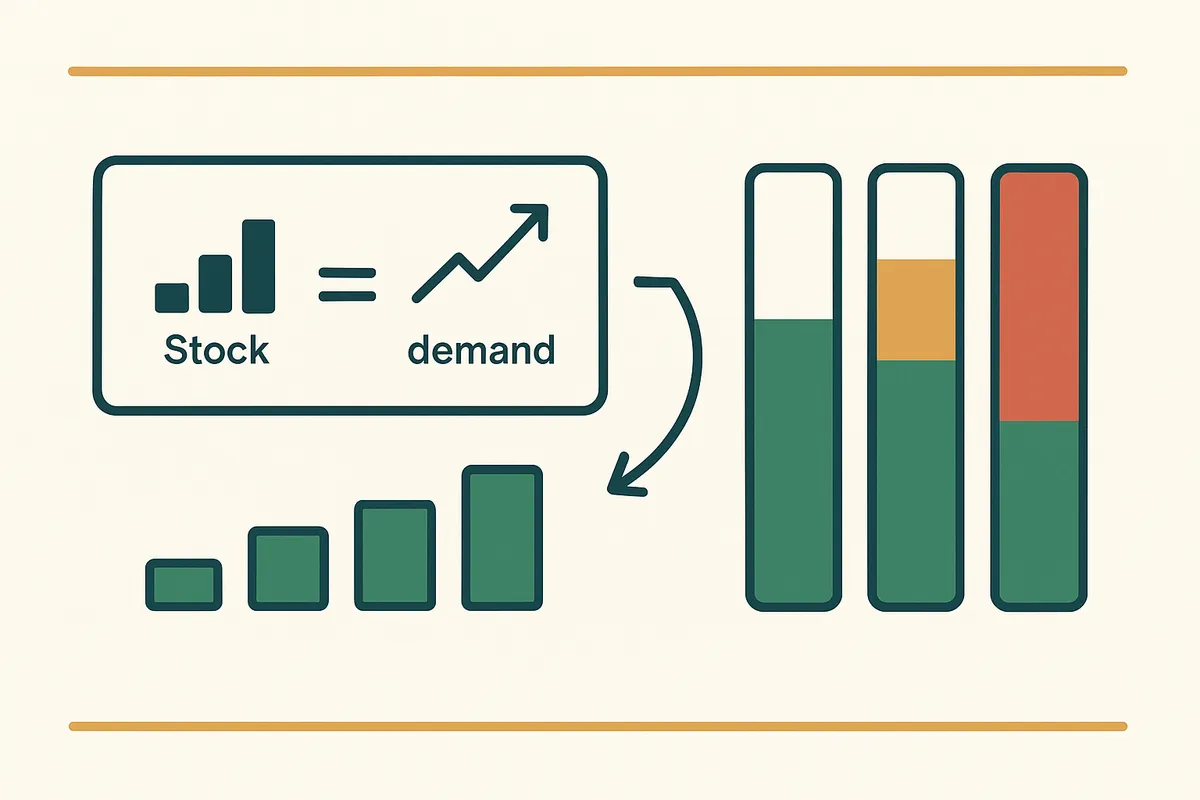
What weeks cover is and why it matters more than stock quantity
Every Shopify merchant can tell you how many units of each product they have in stock. Almost none can tell you how many weeks that stock will last. That gap — between knowing what you have and knowing how long it will last — is where stockouts happen, cash gets tied up in excess inventory, and purchasing decisions become guesswork. Weeks cover bridges that gap. It takes two numbers you already have (stock quantity and sales velocity) and produces one number that is immediately actionable. A product with 500 units sounds comfortable until you realise you sell 100 per week — that is only 5 weeks of cover. A product with 20 units sounds alarming until you realise you sell 1 per week — that is 20 weeks of cover. Raw stock quantities are meaningless without context. Weeks cover provides that context.
The exact formula with step-by-step calculation
The basic weeks cover formula is:
Weeks Cover = Current Stock Quantity / Average Weekly Sales
Step 1: Get your current stock quantity from Shopify. Go to Products > Inventory in your Shopify admin. Note the total available quantity for the SKU you want to analyse.
Step 2: Calculate your average weekly sales. Export your order data for the last 8-12 weeks (avoid shorter periods as they may not capture normal patterns). Count the total units sold for that SKU. Divide by the number of weeks.
Step 3: Divide stock by weekly sales.
Example: You have 240 units of a blue dog collar in stock. Over the last 12 weeks, you sold 360 units. Average weekly sales = 360 / 12 = 30 units per week. Weeks cover = 240 / 30 = 8 weeks.
At current sales velocity, you have 8 weeks of stock remaining for that product.
Choosing the right lookback period for weekly sales
The lookback period — how many weeks of sales data you use to calculate average weekly sales — significantly affects your weeks cover number. Too short (2-4 weeks) and a single promotional week or stockout week skews your average dramatically. Too long (26-52 weeks) and your average may not reflect current demand trends. For most Shopify brands, 8-12 weeks is the sweet spot. It captures enough data to smooth out weekly variations while staying recent enough to reflect current demand. However, if your products are highly seasonal, you may need to use the same period from the previous year as a comparison. Be especially careful with the lookback period for products that were out of stock during part of that period. If a product was unavailable for 3 of the last 12 weeks, using 12 weeks of sales data understates the true weekly velocity. You should either exclude out-of-stock weeks from the calculation or use a period where the product was continuously available.

Real calculation: Bailey & Coco's best-selling collar
Let us work through a real example from Bailey & Coco, a dog accessories brand with 2,845 active SKUs.
Product: Classic Floral Collar — Size Medium Current stock: 186 units Sales data (last 12 weeks): 23, 19, 28, 31, 22, 25, 27, 20, 24, 26, 21, 30 Total sales: 296 units over 12 weeks Average weekly sales: 296 / 12 = 24.67 units/week Weeks cover: 186 / 24.67 = 7.5 weeks
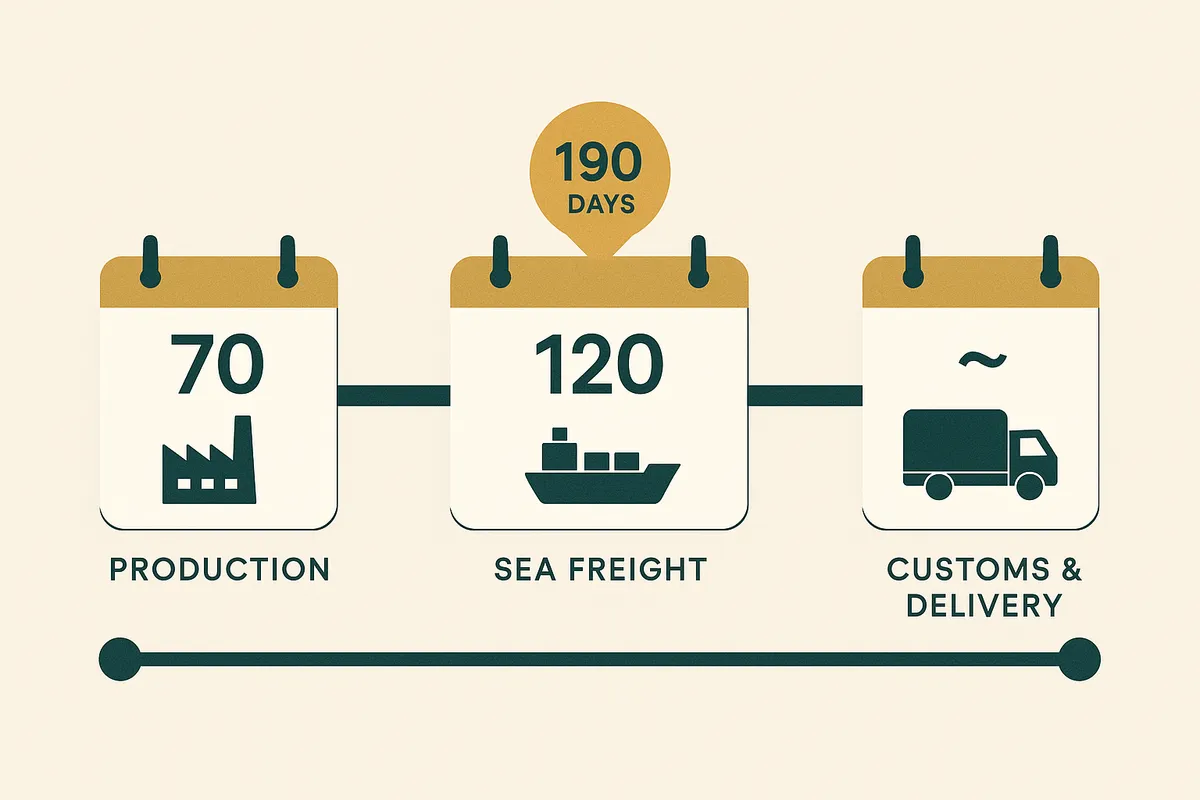
Now here is why this matters for Bailey & Coco specifically: they source from China with a 70-day production lead time and 120-day sea freight. That is 190 days — roughly 27 weeks — from placing a purchase order to receiving stock. With only 7.5 weeks of cover, they are already 19.5 weeks behind where they need to be. If they have not already placed a reorder, this product will be out of stock for at least 12 weeks. At 24.67 units per week with an average selling price of £18.95, that represents approximately £5,600 in lost revenue. One SKU. One miscalculation. That is the power of weeks cover — it makes the urgency visible instantly.
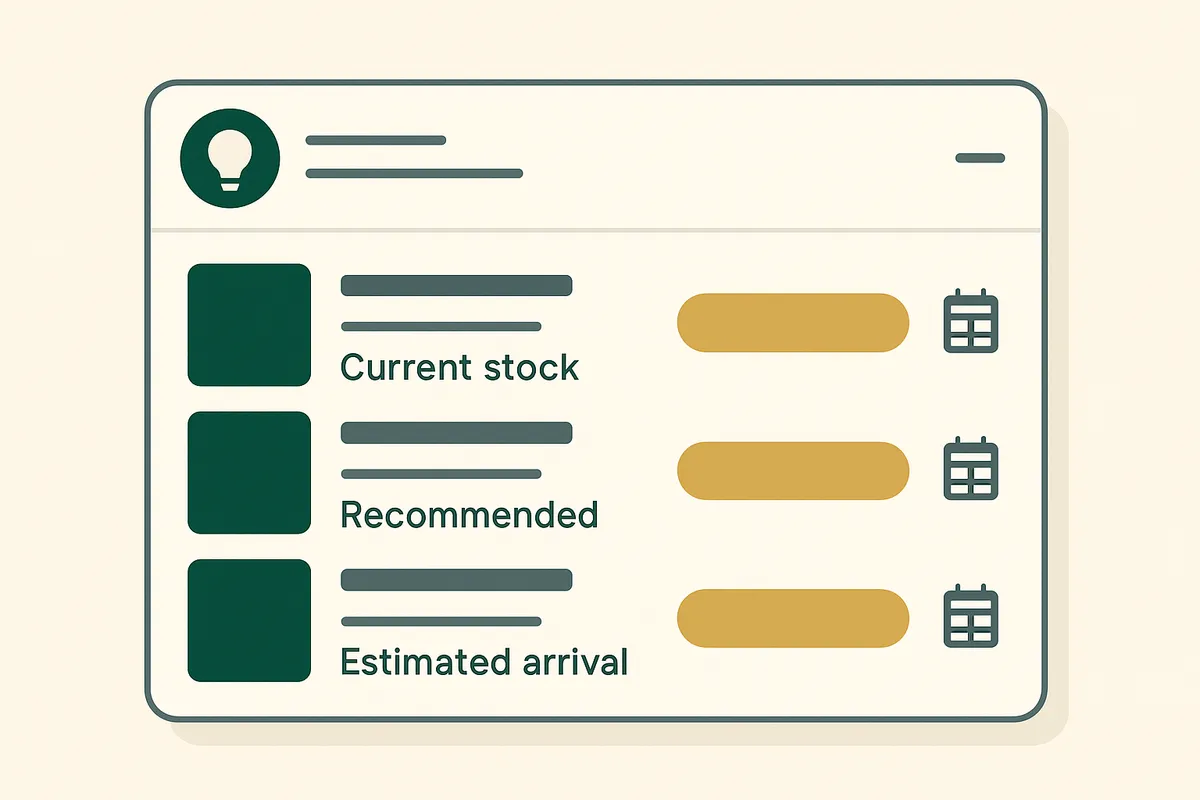
Calculate weeks cover for your entire catalogue in seconds
Canopy gives Shopify brands the inventory clarity they need to grow.
What is a good weeks cover number?
There is no universal answer — ideal weeks cover depends on your supply chain lead time. The rule of thumb is:
Minimum weeks cover = Total lead time (in weeks) + Safety buffer
For a UK brand with domestic suppliers and 1-2 week delivery: target 4-6 weeks cover.
For a brand importing from Europe with 4-6 week lead times: target 8-12 weeks cover.
For a brand importing from China with 20-27 week total lead times: target 30-35 weeks cover on core products.
Anything below your lead time means you are already at risk of a stockout before your next order can arrive. Anything above double your lead time means you may be tying up too much cash in inventory. The sweet spot is lead time plus a 20-30% safety buffer.
How to calculate weeks cover in a spreadsheet
If you want to calculate weeks cover manually for your entire catalogue:
1. Export your inventory from Shopify (Products > Export > select inventory fields) 2. Export your sales by product from Shopify Analytics (Analytics > Reports > Sales by product) 3. In a spreadsheet, create columns: SKU, Product Name, Current Stock, Total Units Sold (last 12 weeks), Average Weekly Sales (total / 12), Weeks Cover (stock / weekly sales) 4. Sort by weeks cover ascending — the products at the top are your most urgent reorder candidates 5. Add a column for supplier lead time and calculate the gap: Weeks Cover minus Lead Time in Weeks. Negative numbers mean you are already behind.
This process works but it is manual, time-consuming, and needs to be repeated every week to stay accurate. For brands with hundreds or thousands of SKUs, automating this calculation is essential.
Common mistakes when calculating weeks cover
- Using total inventory instead of available inventory — committed stock (allocated to unfulfilled orders) should not be counted as available cover
- Ignoring out-of-stock periods in your sales average — if a product was unavailable for 3 weeks, using 12 weeks of data understates true demand
- Forgetting to account for incoming stock — purchase orders in transit should be factored into your forward cover calculation
- Using the same lookback period for all products — fast-moving items need shorter lookback periods (4-6 weeks) to stay responsive, while slow-movers need longer periods (12-26 weeks) for accuracy
- Not recalculating weekly — weeks cover changes every time you make a sale or receive stock, so monthly calculations can be dangerously stale

Frequently Asked Questions
Weeks cover (also called weeks of stock or stock cover) is the number of weeks your current inventory will last at the current rate of sales. It is calculated by dividing your current stock quantity by your average weekly sales velocity. It is the single most important metric for preventing stockouts and managing purchasing decisions.
Shopify does not calculate weeks cover natively. You need to export your inventory levels and sales data, then calculate it in a spreadsheet (Stock / Average Weekly Sales) or use an inventory management app like Canopy that calculates weeks cover automatically for every SKU.
It depends on your supplier lead time. For domestic suppliers with 1-2 week delivery, aim for 4-6 weeks cover. For European imports with 4-6 week lead times, aim for 8-12 weeks. For China imports with 20-27 week lead times, aim for 30-35 weeks on core products. Your minimum weeks cover should always exceed your total lead time.
Use 8-12 weeks of sales data for most products. This period is long enough to smooth out weekly fluctuations but recent enough to reflect current demand. For highly seasonal products, also compare against the same period from the previous year.
No. Stock turn (inventory turnover) measures how many times you sell and replace your entire inventory over a year. Weeks cover measures how many weeks your current stock will last. They are related but weeks cover is more actionable for day-to-day purchasing decisions because it gives you a specific timeline.
Yes, but you need to adjust the lookback period. For products with high demand variability, use a shorter lookback period (4-6 weeks) and add a larger safety buffer to your target weeks cover. For stable-demand products, a longer lookback period (12-26 weeks) gives a more accurate average.
Related pages
Related Articles

Weeks Cover in Stock Management: Formula, Examples & How to Use It
Weeks cover tells you how many weeks your current stock will last at the current sales rate. Learn the formula, what good weeks cover looks like, and how to calculate it for thousands of SKUs.
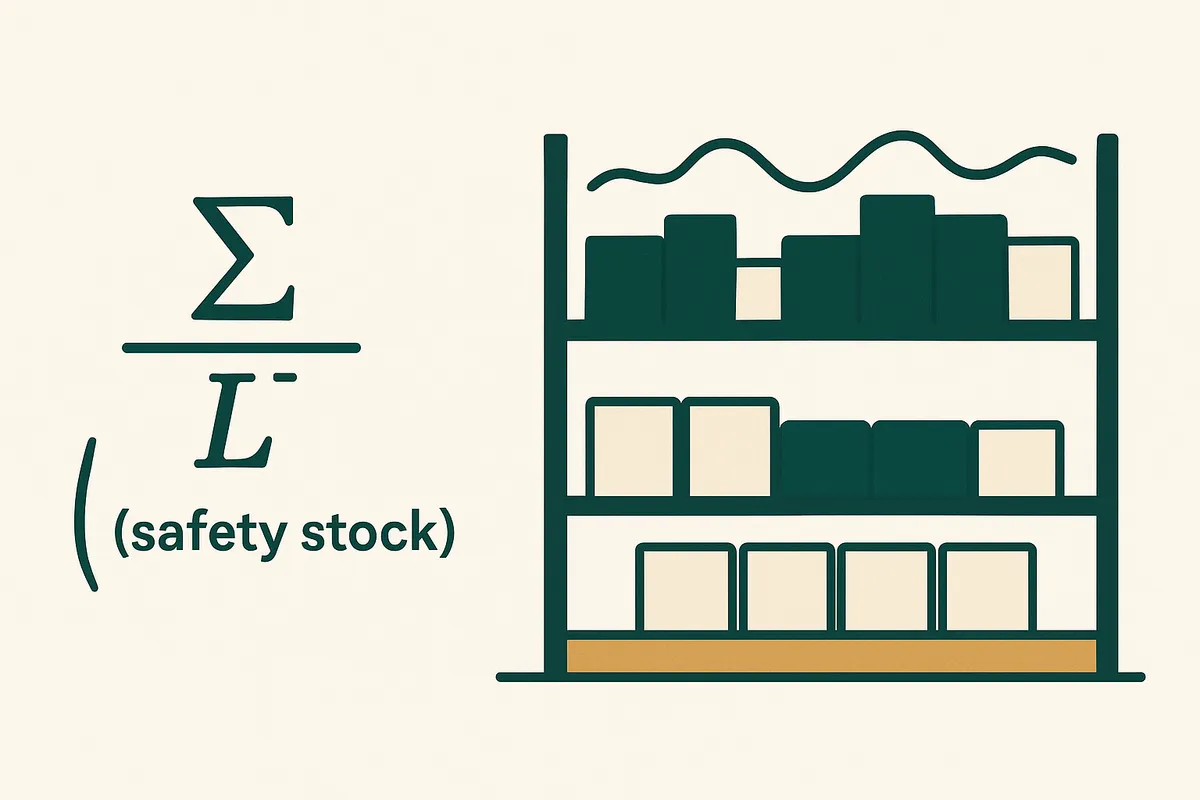
Safety Stock Formula for Ecommerce: The Calculation That Prevents Stockouts
The safety stock formula is Z x σd x √LT — but what does that actually mean? A plain-English breakdown with worked examples for ecommerce brands, including how to calculate safety stock when your lead time is 190 days.
The True Cost of Stockouts: How to Calculate Lost Revenue for Your Shopify Store
Stockouts cost more than lost sales. Learn how to calculate the full cost — including lost customers, SEO impact, and marketplace ranking — with real examples from a Shopify brand.
Get early access to Canopy
The inventory system built for Shopify brands. No spam — just a heads-up when we launch.