Dead Stock: How to Find It, Cost It, and Get Rid of It
By Andrew Simpson

Quick answer
Dead stock is inventory that hasn't sold in a defined period — typically 90-180 days — and shows no realistic prospect of selling at full price. It's different from slow-moving stock, which is selling but below target velocity. The average ecommerce brand carries 20-30% of its inventory value in dead stock. The real cost isn't the purchase price — it's the opportunity cost of cash locked up in unsellable products plus the ongoing storage expense. Identifying dead stock requires tracking weeks cover and sell-through rate at the variant level.
What dead stock actually is (and isn't)
Dead stock is not simply products that sell slowly. Every catalogue has items with different velocities — your bestseller collar might sell 40 units per week while a niche bandana sells 2 per week. The bandana isn't dead stock if 2 per week is its natural demand and you've ordered accordingly.
Dead stock is inventory where the mismatch between supply and demand is irrecoverable at current pricing. Specifically, it's stock where:
- Zero units have sold in the last 90 days despite being in stock and visible on your site - The sell-through rate is so low that your current stock will last 52+ weeks at the current pace - The product has been superseded, discontinued, or made irrelevant by a trend shift - The product is seasonal and you've passed the selling window
The critical distinction is that dead stock isn't just about low sales — it's about the gap between what you hold and what will realistically sell. Having 5 units of a slow mover isn't a problem. Having 500 units of the same product is dead stock.
Why dead stock is more expensive than you think
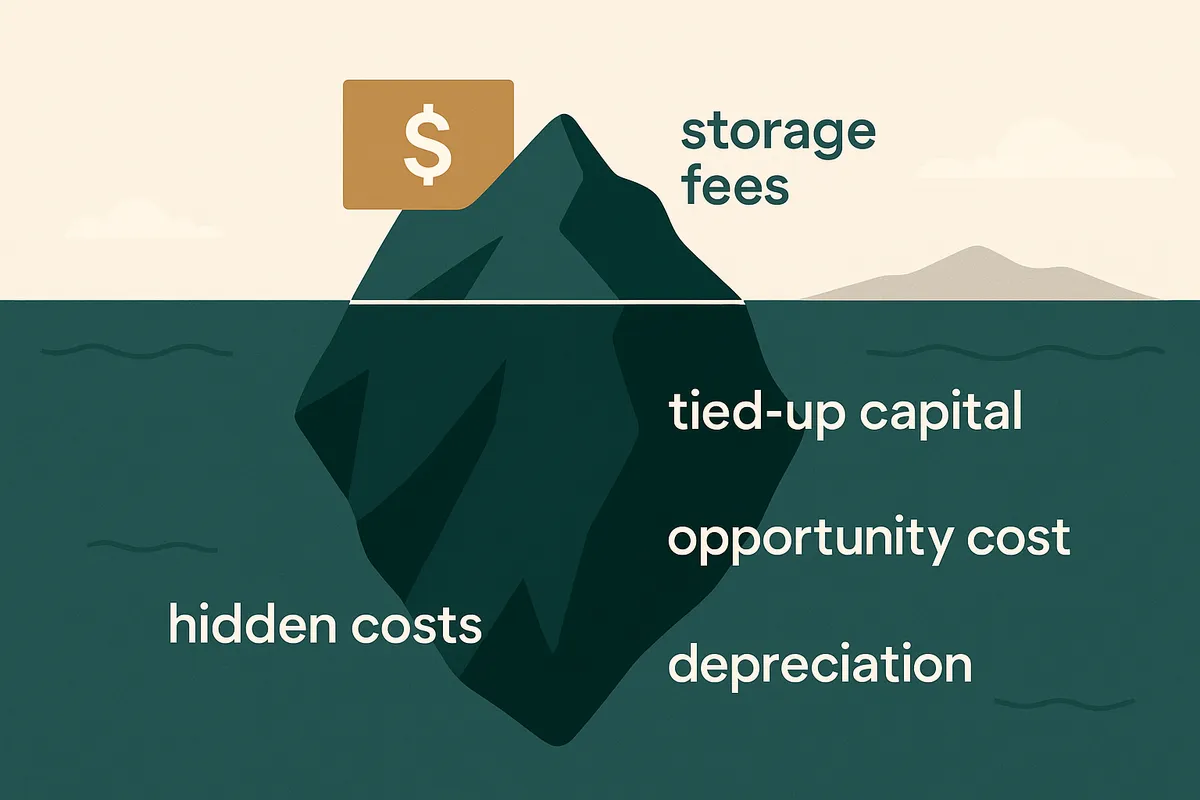
Most merchants think about dead stock in terms of the purchase price: "I bought £5,000 of product that isn't selling — I've lost £5,000." The actual cost is significantly higher.
The carrying cost of inventory includes storage space, insurance, shrinkage (damage, theft, obsolescence), and the opportunity cost of capital. Industry research from the Warehousing Education and Research Council puts the annual carrying cost at 20-30% of the inventory's value.
So that £5,000 of dead stock isn't costing you £5,000. It's costing you: - £5,000 in purchase cost (sunk) - £1,000-1,500/year in carrying costs (ongoing) - The margin you would have earned if that £5,000 had been invested in your best-selling SKUs instead (opportunity cost)
If your best-selling products have a 60% gross margin and turn over 6 times per year, that £5,000 invested in winners instead of dead stock would have generated £18,000 in revenue and £10,800 in gross profit. The true cost of the dead stock isn't £5,000 — it's closer to £12,000 when you factor in the opportunity cost and carrying expenses over a year.

How Bailey & Coco found £23,000 in dead stock
When Bailey & Coco first audited their full inventory by weeks cover, the results were uncomfortable. Out of 2,845 active SKUs, 312 had over 52 weeks of cover — meaning at current sales rates, they wouldn't sell through for over a year. Another 187 SKUs had literally zero sales in the previous 90 days.
The total cost value of this dead and near-dead inventory was £23,400. Broken down by category:
- Seasonal patterns ordered for summer 2025 that didn't sell through: £8,200 (154 SKUs) - Discontinued collar hardware variants where the supplier had changed buckle design: £4,100 (43 SKUs) - Over-ordered sizes — specifically XS and XXL sizes that were ordered in the same quantities as M and L despite selling at 1/8th the rate: £6,800 (198 SKUs) - Genuinely unpopular patterns that were bought based on the founder's personal taste rather than data: £4,300 (104 SKUs)
The over-ordered sizes category is the one that resonates with most ecommerce brands. It's incredibly common to order a flat size curve (equal quantities of each size) when the actual demand curve is heavily weighted toward the middle sizes. If you sell 8 Medium collars for every 1 XS collar but order them equally, you're manufacturing dead stock with every purchase order.
Spot dead stock before it drains your cash
Canopy gives Shopify brands the inventory clarity they need to grow.
How to identify dead stock in your catalogue
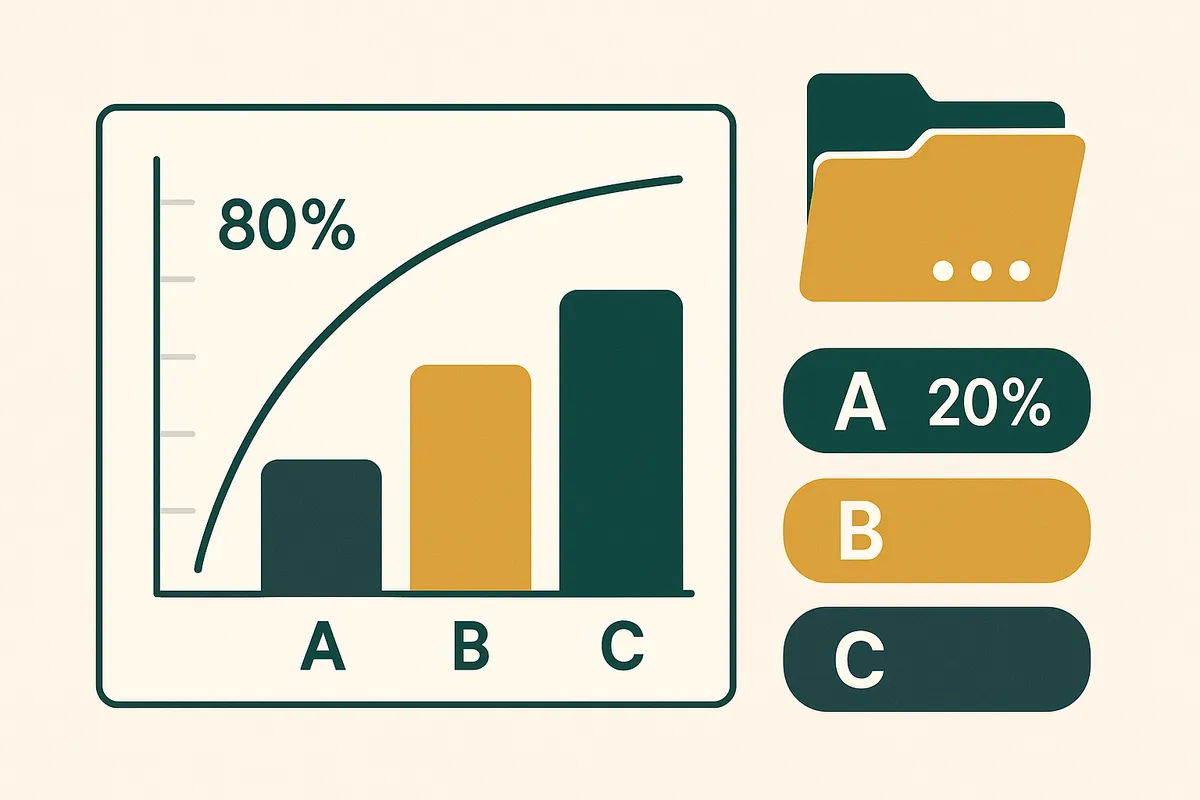
You need to run this analysis at the variant level, not the product level. A product can look healthy in aggregate while individual variants are completely dead. Here's the process:
- Export your variant-level inventory data from Shopify — you need: variant SKU, current stock quantity, cost per unit, and total value for each variant.
- Export your variant-level sales data for the last 90 and 180 days — units sold, not revenue. You need the unit count to calculate sell-through rate.
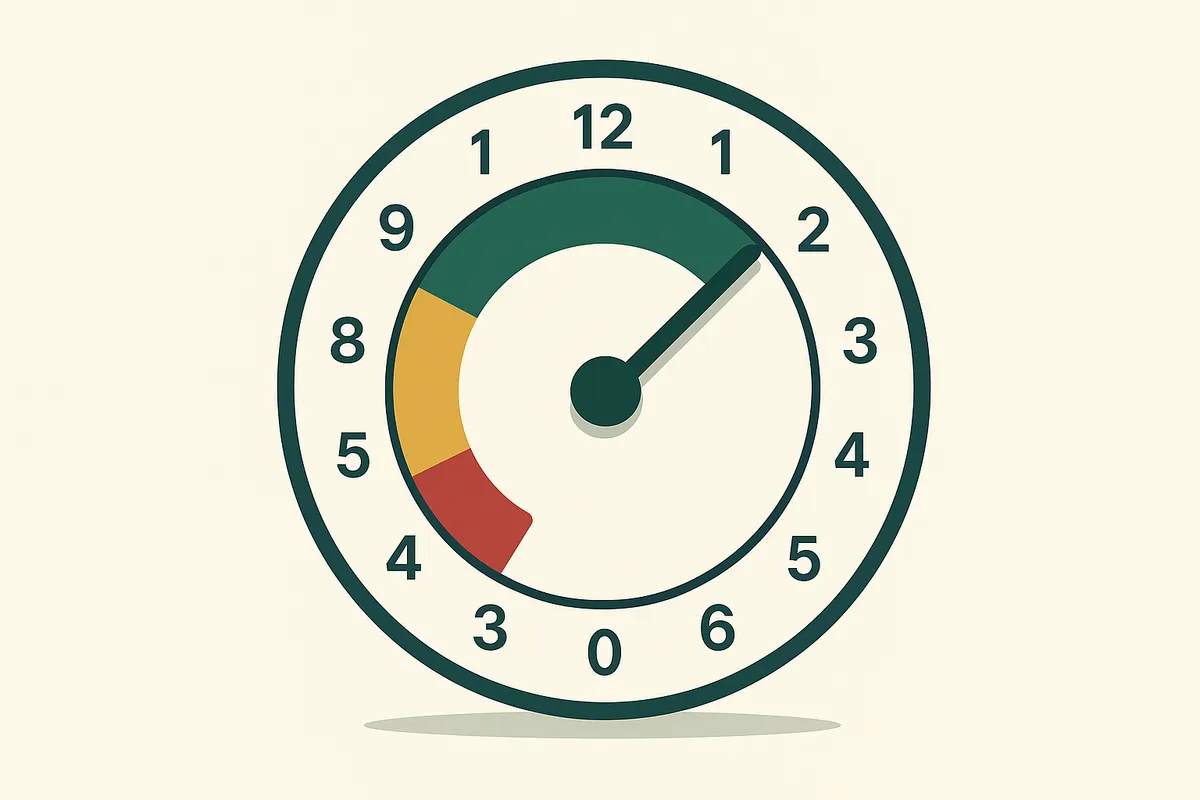
- Calculate weeks cover for every variant — Current Stock / (Units Sold in Last 90 Days / 13 weeks). Any variant with 52+ weeks cover goes on the dead stock watchlist.
- Flag zero-sellers — any variant with zero units sold in 90 days while having stock available is dead by definition. Separate these for immediate action.
- Calculate total dead stock value — multiply the quantity of each dead stock variant by its cost price. This is the cash locked in unsellable inventory.
- Categorise the reasons — seasonal miss, over-ordered, discontinued, unpopular, damaged. Each reason has a different clearance strategy.
- Set up ongoing monitoring — dead stock identification isn't a one-time audit. You need weekly or fortnightly reporting to catch SKUs before they cross the dead stock threshold.

Clearance strategies that actually recover cash
Once you've identified dead stock, you have five main options, and they should be pursued roughly in this order of preference:
1. Bundle with bestsellers. Pair dead stock items with popular products as a "gift with purchase" or value bundle. This has the highest margin recovery because you're not discounting — you're adding perceived value to a sale that was going to happen anyway. Bailey & Coco bundled dead bandana variants with their bestselling collar sets and cleared £3,400 of dead stock in 6 weeks with zero margin erosion on the collar.
2. Flash sale at 40-60% off. Run a 48-72 hour sale on dead stock items specifically. Don't dilute your regular pricing by putting these in a site-wide sale. Create a dedicated clearance collection. Email your list with honest positioning: "We over-ordered these — your gain."
3. B2B liquidation. Sell to liquidation buyers at 10-20% of retail. The recovery is low but it's immediate cash and frees up warehouse space. In the UK, companies like John Pye Auctions, Gem Imports, and Liquidity Services handle ecommerce liquidation.
4. Donate for tax benefit. In the UK, donating stock to registered charities can be written off against Corporation Tax. The tax benefit is typically 19% of the cost value — so £5,000 of dead stock donated saves £950 in tax.
5. Write off and destroy. The last resort. If the product has no resale value, no donation value, and is costing you storage space, write it off. The important thing is to do it quickly rather than paying storage costs on items you'll eventually bin anyway.
Preventing dead stock from building up
Clearance is damage control. The real win is preventing dead stock from accumulating in the first place. That requires three things:
First, order based on demand data, not intuition. Every purchase order should be justified by sell-through rate and weeks cover calculations, not by what looks good in a supplier's catalogue. If a variant sells 2 units per week and you have 15 weeks cover, you don't need to order more — regardless of whether the supplier is offering a volume discount.
Second, use a size and colour curve based on actual sales data. If your Medium outsells your XS by 8:1, your purchase orders should reflect that ratio. Most dead stock is created by flat ordering across variants.
Third, monitor weeks cover continuously. A product isn't dead stock overnight — it drifts into dead stock territory over weeks and months. If your system flags a SKU when it crosses 26 weeks cover (6 months), you still have time to discount it, bundle it, or reduce your next order before it becomes truly dead.
Canopy is building this preventive approach into its core workflow. Every SKU gets a live weeks cover reading. When cover exceeds a configurable threshold, the system alerts you with specific actions: reduce next PO quantity, start a markdown, or flag for bundling. The goal is to catch dying stock while it's still warm, not after it's been gathering dust for a year.
Frequently Asked Questions
Dead stock is inventory that has not sold in a defined period (typically 90-180 days) and has no realistic prospect of selling at full price. It differs from slow-moving stock, which sells below target velocity but still has demand.
Total dead stock cost = purchase price (sunk cost) + annual carrying costs (20-30% of inventory value) + opportunity cost of capital (what you would have earned investing that cash in bestselling SKUs instead). The true cost is typically 2-3x the purchase price.
Research suggests 20-30% of the average ecommerce brand's inventory value is tied up in dead or near-dead stock. For brands that order based on gut feel rather than data, this figure can be 40% or higher.
At minimum quarterly, ideally monthly. With an automated weeks cover dashboard, you can monitor continuously and catch SKUs drifting toward dead stock status before they get there.
Yes. In the UK, donating stock to registered charities allows you to write off the cost value against Corporation Tax (currently 19%). Donating £5,000 of dead stock saves approximately £950 in tax, plus you eliminate ongoing carrying costs.
Order based on sell-through data rather than intuition, use variant-level demand curves for sizing (don't order flat quantities), and monitor weeks cover continuously to catch SKUs before they drift into dead stock territory.
Related pages
Related Articles
Weeks Cover in Stock Management: Formula, Examples & How to Use It
Weeks cover tells you how many weeks your current stock will last at the current sales rate. Learn the formula, what good weeks cover looks like, and how to calculate it for thousands of SKUs.
Shopify Inventory Management in 2026: What's Built In, What's Missing & What You Actually Need
Shopify's native inventory features have improved, but critical gaps remain. This guide covers what Shopify can and can't do for inventory management, the best apps to fill the gaps, and how to build a system that scales.
Stocky App Shutting Down: What Shopify Merchants Need to Do Before August 2026
Shopify's Stocky app is shutting down on 31 August 2026. Here's what happens to your purchase orders, demand forecasting, and stock reports — and the best Stocky replacements to migrate to.
Get early access to Canopy
The inventory system built for Shopify brands. No spam — just a heads-up when we launch.