Fashion Ecommerce Inventory: Managing Sizes, Colours & Seasonal Collections
By Canopy Team
Quick answer
Fashion ecommerce inventory is uniquely complex because of variant multiplication (5 sizes x 8 colours = 40 SKUs per style), seasonal obsolescence (unsold summer stock loses most of its value by autumn), and high return rates (25-40% in apparel vs 5-10% in general ecommerce). Effective fashion inventory management requires size curve forecasting (ordering based on historical size distribution, not equal quantities per size), colour-level demand analysis, markdown timing discipline, and a returns processing workflow that gets returned items back to sellable stock within 48 hours.
Why fashion inventory is different from everything else
A brand selling kitchen appliances might have 50 SKUs. A fashion brand with the same number of styles has 50 x 5 sizes x 4 colours = 1,000 SKUs. This variant multiplication is the fundamental challenge. Every inventory management decision — forecasting, reordering, allocating, marking down — has to be made at the variant level, not the style level.
The second unique challenge is time sensitivity. A kitchen appliance does not go out of season. A summer dress loses 50-70% of its sell-through potential once autumn arrives. This creates an urgency around markdown timing that does not exist in most other ecommerce categories. Mark down too early and you leave margin on the table. Mark down too late and you are stuck with unsellable stock that occupies warehouse space for 9 months until next summer.
The third challenge is returns. Fashion has the highest return rate in ecommerce — industry data suggests 25-40% for apparel, compared to 5-10% for general ecommerce. Every return is a unit that was sold but is coming back — and the speed at which you process that return back to sellable stock directly impacts your available inventory for the next customer.
Size curve forecasting: stop ordering equal quantities
The most expensive mistake in fashion inventory is ordering equal quantities of each size. If you order 100 units each of XS, S, M, L, and XL, you will stockout on M and L while sitting on excess XS and XL — because size demand follows a bell curve, not a flat distribution.
A size curve is the percentage breakdown of how each size sells relative to total style sales. A typical UK women's fashion size curve might be: XS 8%, S 20%, M 32%, L 25%, XL 15%. That means if you are ordering 500 units total, the correct split is: XS 40, S 100, M 160, L 125, XL 75.
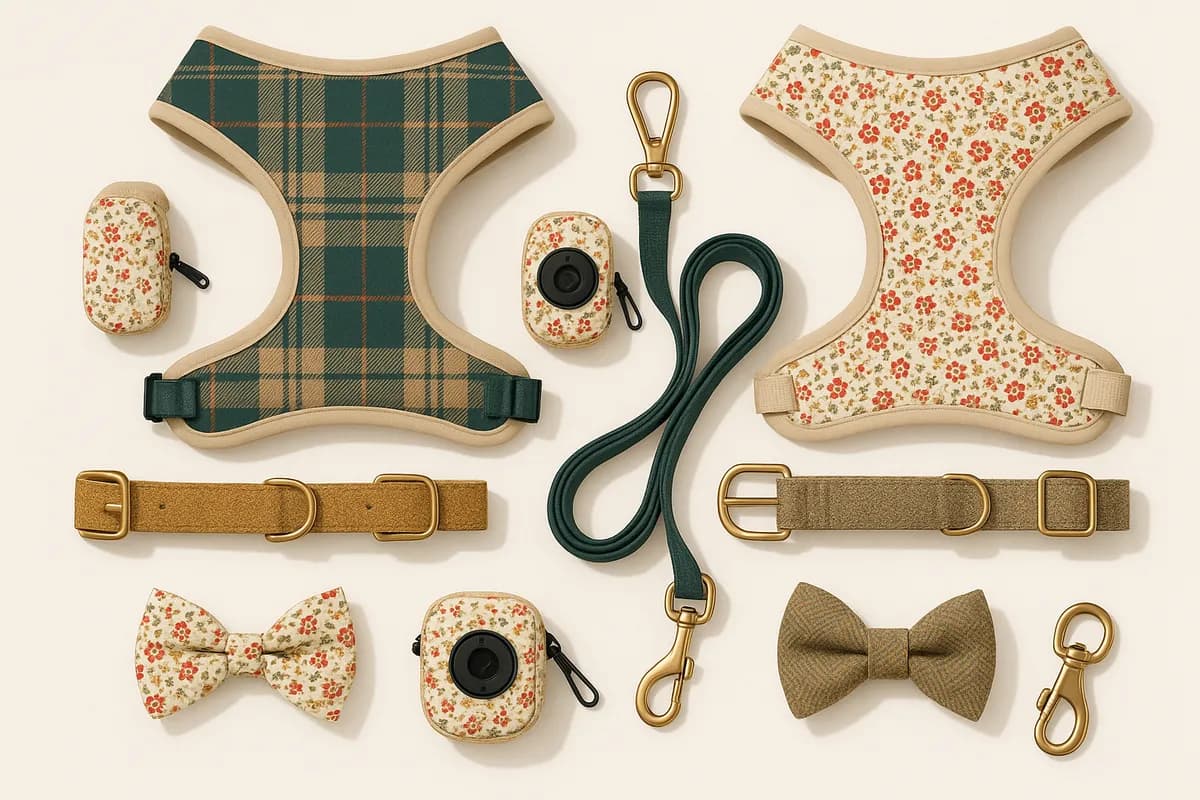
Critically, your size curve is specific to your brand and your customers. The industry average is a starting point, but after 2-3 seasons of sales data, you should be using your actual size distribution. Bailey & Coco found that their size curve for dog collars skewed heavily toward Medium — 42% of collar sales — because the most common dog breeds in the UK (Labradors, Spaniels, French Bulldogs) are medium-sized. Ordering equal quantities by size would have left them chronically short on Medium and overstocked on XS and XL.
Colour variant analysis: which colours to invest in
Colours are harder to forecast than sizes because they are driven by trend cycles rather than demographic distributions. A size curve is relatively stable year-over-year — your customer base does not suddenly become 50% XL. Colour preferences can shift dramatically: a colour that sold 15% of your range last year might drop to 5% this year if the trend cycle moves on.
The practical approach: divide your colours into three tiers. Core colours (black, navy, grey — the colours that sell consistently every season regardless of trends) get 50-60% of your colour allocation. Trend colours (the current season's fashion colours) get 25-35%. Experimental colours (new colours you are testing) get 10-15%.
Bailey & Coco applies this to their 152 pattern variants. Core patterns (Navy Tartan, Classic Black, Stone) make up about 55% of production orders. Popular patterns from previous seasons (Floral Pink, Highland Green) get 30%. New designs launching for the first time get 15%. This tiered approach limits the downside risk on colours that do not sell while ensuring core bestsellers are always in stock.

Seasonal collection timing: the 4-season challenge
Fashion ecommerce typically operates on a 4-season calendar: Spring/Summer (SS) drops February-March, sells through April-August; Autumn/Winter (AW) drops August-September, sells through October-February. Within each season, there may be sub-drops or capsule collections that create additional inventory management complexity.
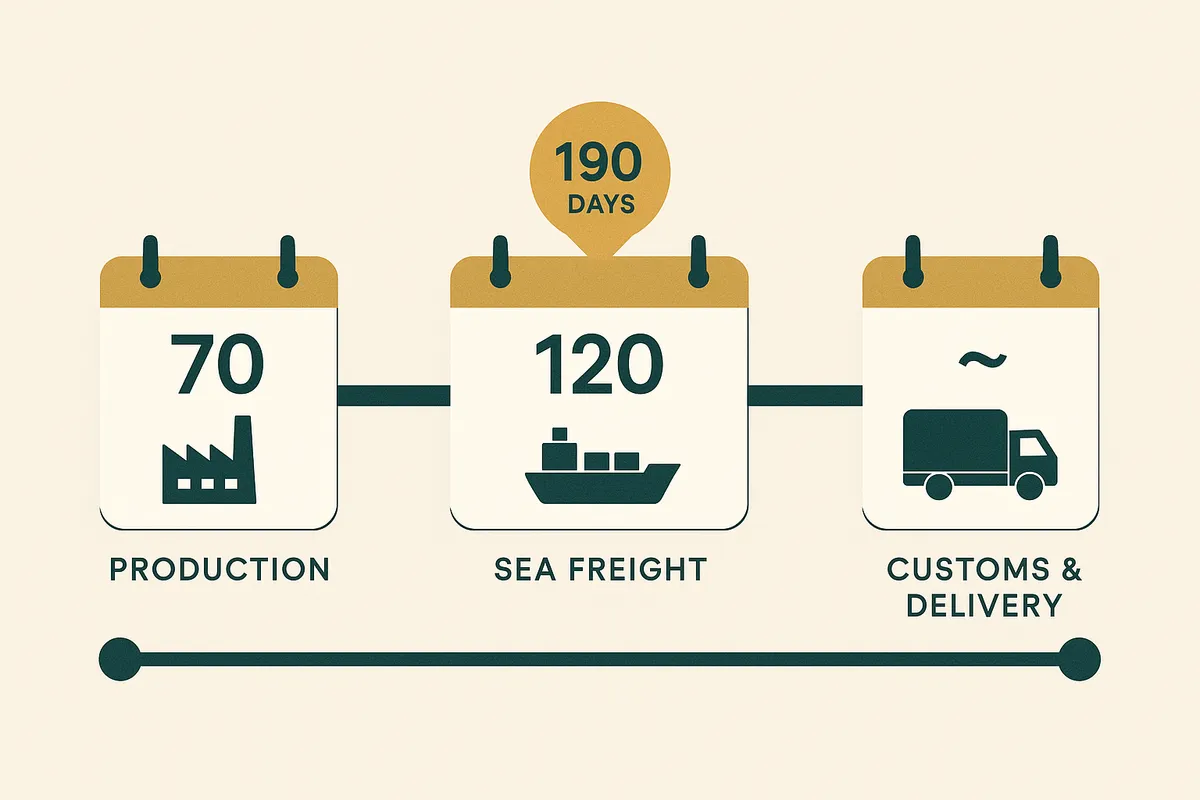
The timing challenge is that production and ordering happen months before the selling season. SS production orders typically go in October-November for delivery in January-February. AW orders go in April-May for delivery in July-August. If you source from China with 190-day lead times, the calendar is even more compressed.
This means you are making purchasing decisions for your SS collection in autumn, when you have no current-season data. You are relying on last year's SS performance, adjusted for growth trends and new styles. The accuracy of these forecasts — especially for new styles with no sales history — determines whether you have a profitable season or one where you end up marking down 40% of your range.
Best practice: over-order on core/carry-over styles (you have historical data, the risk is low) and under-order on new styles (test with smaller quantities, then reorder via air freight if demand materialises). This limits downside risk while ensuring your proven sellers are in stock.
Returns: the 30% wildcard
A 30% return rate means that for every 100 units you sell, 30 come back. These returned units are not lost sales — they are inventory that needs to be processed and returned to sellable stock as quickly as possible. The speed of returns processing directly impacts your weeks cover accuracy and available inventory.
If you process returns within 24-48 hours, those units are back on your shelves and available for the next customer. If returns sit in a pile for a week, your system shows lower stock than you actually have — which might trigger unnecessary reorders or prevent you from selling units that are physically available but not system-available.
Fashion return reasons vary, and each has different inventory implications. "Wrong size" returns (50-60% of fashion returns) go straight back to sellable stock. "Not as described" or "quality issue" returns (10-15%) need inspection and may need to be written off. "Changed mind" returns (25-35%) go back to sellable but may need repackaging.
Bailey & Coco's return rate is lower than apparel average — approximately 12% — because dog accessories are less subject to fit uncertainty than clothing. But that 12% still represents roughly 340 units per month that need to be processed. They use a dedicated returns location in Shopify to separate returned stock from sellable stock until inspection is complete.
Fashion-grade variant management for Shopify
Canopy gives Shopify brands the inventory clarity they need to grow.
Markdown timing: when to discount and by how much
Markdown discipline separates profitable fashion brands from those that haemorrhage margin every season. The rule: if a style is not meeting its sell-through rate by the midpoint of its selling season, mark it down. Do not wait until end of season when everyone else is discounting and competition for discount-seeking customers is fiercest.
A practical markdown cadence for fashion ecommerce:
Weeks 1-4 of season: Full price. No discounts. Measure initial sell-through.
Week 5-6 (midseason check): Review sell-through rates. Any style below 40% of expected sell-through gets flagged.
Weeks 7-8: First markdown: 20-25% off on flagged styles. This catches early discount shoppers.
Weeks 9-10: Second markdown: 40-50% off on remaining flagged stock. Priority is clearing units, not maximising margin.
Week 11+ (end of season): Final clearance: 60-70% off. The goal is to recover whatever cash you can. Carrying unsold seasonal stock into the next year costs more in warehousing and opportunity cost than selling at a steep discount.
The common mistake: holding stock hoping it will sell, then being forced into a single massive markdown at end of season. Progressive markdowns recover more total cash because different customer segments shop at different discount tiers.

Tools for fashion inventory management
Fashion inventory demands specific capabilities from your inventory management tool:
Variant-level tracking — not just product-level. You need weeks cover per size per colour, not averaged across the style.
Size curve analytics — the tool should show you your actual size distribution so you can order proportionally.
Sell-through rate monitoring — real-time sell-through as a percentage of initial stock, per variant, with alerts when rates fall below threshold.
Seasonal lifecycle management — the ability to mark styles as seasonal and track their lifecycle from launch to clearance.
Returns integration — returned units updating available stock in real-time, with quality categorisation.
Canopy is built to handle variant complexity — the same technology that manages Bailey & Coco's 2,845 SKUs across 152 patterns works for any fashion brand dealing with size-colour variant multiplication. Weeks cover is calculated per variant, not per style, and reorder suggestions account for size curve distribution automatically.

Frequently Asked Questions
A size curve is the percentage breakdown of demand by size for a given style. For example: XS 8%, S 20%, M 32%, L 25%, XL 15%. Ordering according to your size curve prevents stockouts on popular sizes and overstock on less common sizes.
A healthy full-price sell-through rate is 60-70% of initial stock by end of the selling season. Below 50% typically means you over-ordered or the product did not resonate. Above 80% might mean you under-ordered and left revenue on the table.
Returns (25-40% in apparel) are inventory coming back that needs processing. Speed matters — returned units sitting unprocessed for days reduce your available stock and distort weeks cover calculations. Process returns within 24-48 hours.
Review sell-through at the midpoint of the selling season. Any style below 40% of projected sell-through should be marked down 20-25%. Progressive markdowns (20%, then 40%, then 60%) recover more total cash than a single end-of-season clearance.
A fashion brand with 50 styles in 5 sizes and 4 colours has 1,000 SKUs. Brands with broader size ranges, more colourways, or multiple product categories can easily exceed 5,000 SKUs. Each SKU needs individual forecasting and tracking.
Yes. Canopy calculates weeks cover per variant (size-colour combination), not per style. Size curve analytics show your actual demand distribution, and reorder suggestions automatically apply your size curve to maintain proportional stock across sizes.
Related pages
Related Articles

Dead Stock in Ecommerce: How to Identify, Calculate Cost & Eliminate It
Dead stock costs the average Shopify merchant 20-30% of their inventory value. Learn how to identify dead stock, calculate the true carrying cost, and build clearance strategies that recover cash.

Overstock Management for Ecommerce Brands: Prevention, Identification & Liquidation
How overstock happens in ecommerce, the cash flow trap it creates, and practical strategies for prevention and liquidation. Real examples from a 2,845-SKU Shopify brand.

Seasonal Weeks Cover Adjustments: How to Plan Inventory for Black Friday, Christmas & Summer
Learn how to adjust your weeks cover targets for seasonal peaks in ecommerce. Covers Black Friday, Christmas, summer lulls, and how to use Bailey & Coco's seasonal patterns to plan smarter.
Get early access to Canopy
The inventory system built for Shopify brands. No spam — just a heads-up when we launch.